LQATS Supplier Performance Non-conformance Pareto Chart, OQL By Month Chart and Irregular Data Chart
Supplier Performance Non-Conformance refers to situations where a supplier does not meet the agreed-upon standards, specifications, or performance metrics in a business contract or agreement. It indicates that the supplier’s goods, services, or overall performance fail to align with the expectations set forth in the procurement process.
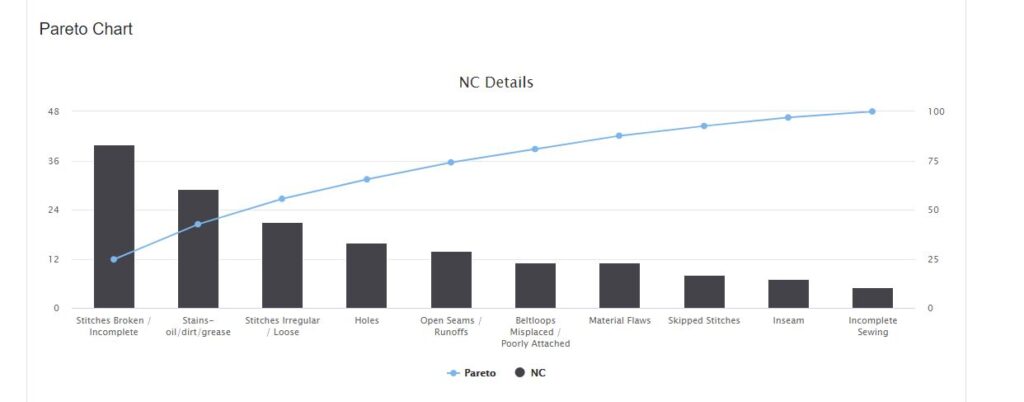
Pareto Chart
The Pareto Chart is one of the most commonly used tools to ensure product quality standards. It helps indicate the percentage of defects in Supplier Performance Non-Conformance over a period of time. This analysis helps estimate whether the defects are decreasing over time. The Pareto Chart presents data as a histogram with values plotted in descending order, along with a line graph that tracks the cumulative total.
Quality managers use Pareto charts to monitor the frequency of various types of non-conformance events and their causes. By understanding the most common causes of Supplier Performance Non-Conformance defects, quality managers can focus their efforts on reducing incidences of non-conforming products. The length of each bar in the Pareto Analysis represents the frequency of non-conformance, with the longest bars on the left and the shortest on the right. This arrangement visually highlights which situations are more significant. The Pareto Chart is considered one of the seven basic quality tools.
Supplier Business Review
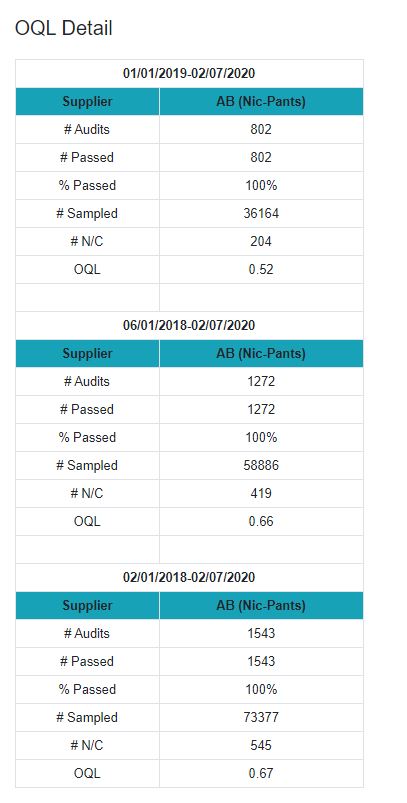
LQATS Supplier Business Review Report allows users to select specific locations, suppliers, or date ranges. The output can be downloaded as HTML or Excel, and users can also email the results directly to the supplier.
Supplier Business Review Report includes
-Number of Audits
-Number of Passed
-Percentage of Passed
-Number of Sampled
-Number of Non-Conformance
-OQL (Observed Quality Level)
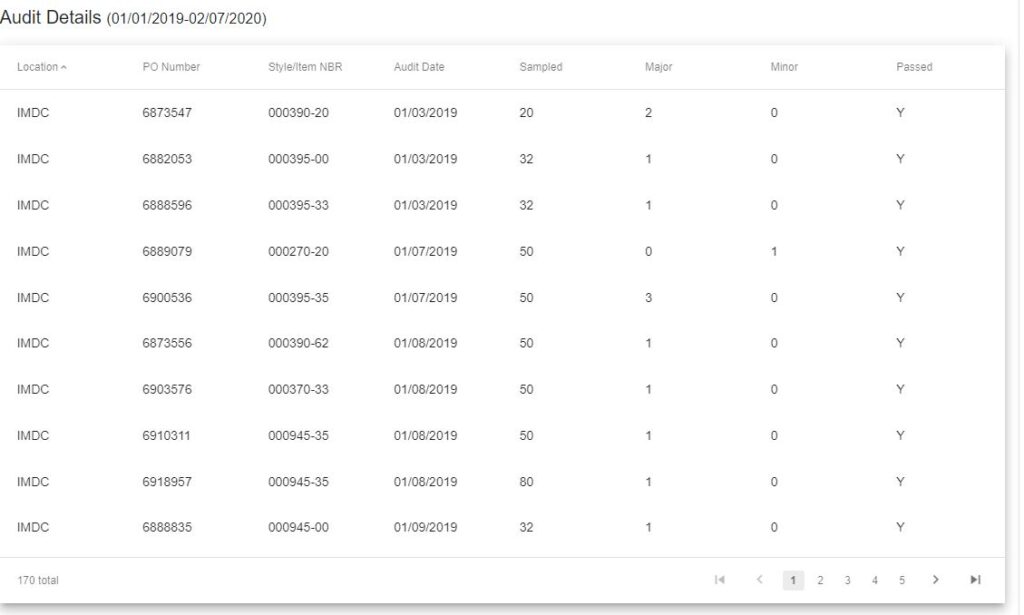
Audit Details section of Supplier Business Review report includes
-Location
-Purchase Order Number
-Style/Item NBR
-Number of Sampled
-Audit date
-Number of Major defects
-Number of Minor defects
-Pass or Fail
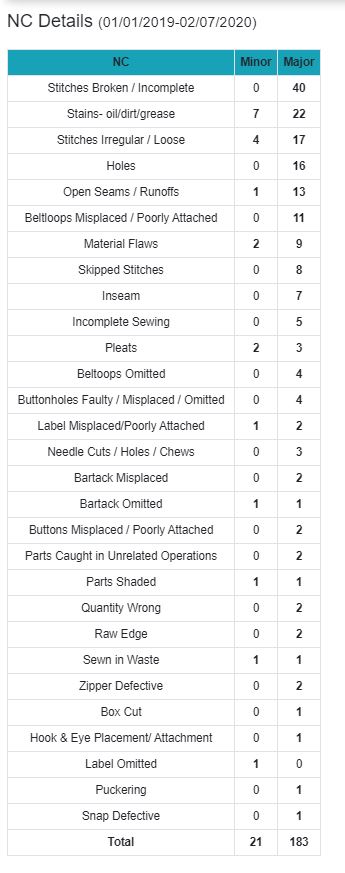
Supplier Performance Non-Conformance section of Supplier Business Review report includes
-Type of Non-conformance
-Major Non-conformance
-Minor Non-conformance
OQL refers to the degree to which a supplier’s products meet predetermined quality standards, such as specifications for quality, consistency, reliability, and other performance metrics.
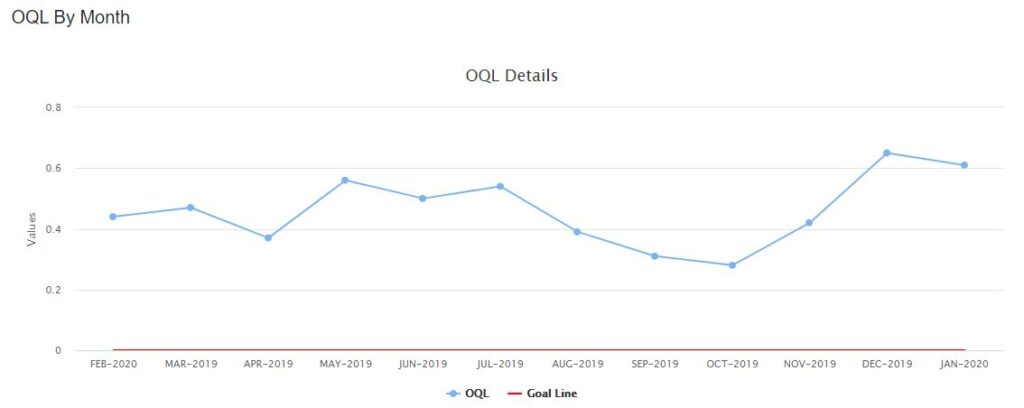
OQL by Month
OQL by Month displays line graphs showing Supplier Performance Non-Conformance OQL for the past 12 months, comparing it against the OQL Goal.
Irregular Data are line graphs for displaying Irregulars for Fabric, Manufacturing and Total for the past 12 months.
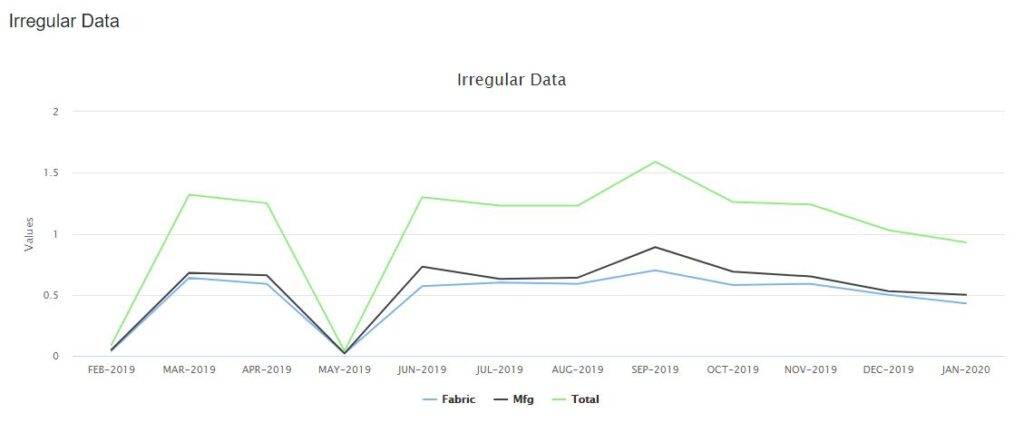
LQATS Supplier Business Review Irregular Data Graph

